West Bengal now moves to exclude even ‘verified’ Muslim voters
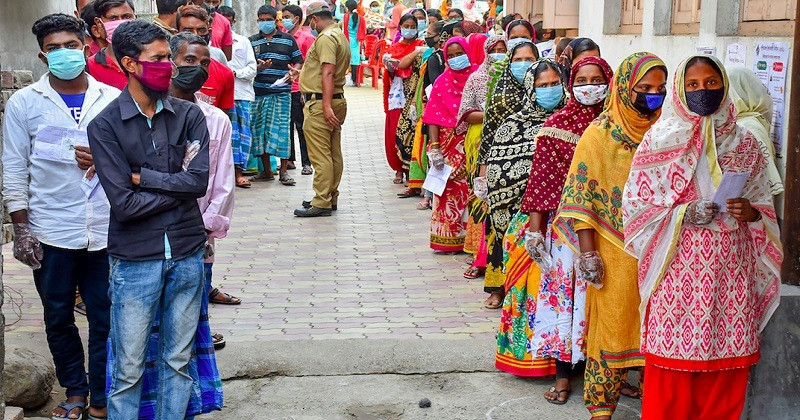
Chanchal is a mixed rural and urban constituency in Malda district of West Bengal. Its constituency number is 45, and it does not lie on the Bangladesh border. By population, 88 percent of its people belong to three groups. They are 51.96 percent Muslims, 21.90 percent Scheduled Castes (SC) and 14.16 percent Scheduled Tribes (ST).
During the Special Intensive Revision (SIR), officials flagged 30.1 percent of Chanchal voters, or 73,901 people. After a judicial review, almost all of these flags failed. Judges declared 69,731 names valid and removed only 4,170 voters. The removal rate was just 5.6 percent. The state average is 45.4 percent, so Chanchal has the third lowest rate. This shows that the first flags were wrong.
The story does not end here. Data from the Election Commission of India (ECI) shows that voters filed 38,564 new appeals in Chanchal, even though very few voters lost their names. That means 9.25 appeals for every removed voter. The state average is only 1.40 appeals for every removed voter.
Who filed these appeals?
The investigation found that removed voters did not file most of these 38,564 appeals. A volunteer research body called the Civic Research Group tracked each voter card (EPIC) number from the ECI removal list. It then checked each number on the official portal. In Chanchal, only 2,892 removed voters appealed to get their names back.
The rest of the count shows that about 35,007 appeals, or 90.8 percent, were filed against the inclusion of voters. In simple words, people filed these new applications to cut names that judges had already declared valid. Judges had kept these names on the voter list.
The figure is shocking. More than half of the voters whom judges cleared in Chanchal, exactly 50.2 percent, now face new applications to remove them. These cases also move very slowly. Only 31 of the 38,564 appeals, or 0.08 percent, have ended so far. Every one of those rulings kept the voters’ names on the list.
The same pattern across Malda
Chanchal is not a single case. Across the 12 seats of Malda, 58.4 percent of all appeals ask to remove names that courts had accepted. This is the highest share among all districts in the state. On average, Malda seats have 42.52 percent Muslims, 19.61 percent Scheduled Castes and 8.40 percent Scheduled Tribes. The data makes one thing clear. The more Muslims a seat has, the higher its rate of removal appeals.
Habibpur has the fewest Muslims in Malda, at 4.64 percent. It also has the lowest rate of removal appeals, at 31.6 percent. English Bazar has the second fewest Muslims, at 19.57 percent, and the second lowest rate, at 39.0 percent. Sujapur has the most Muslims, at 75.44 percent. It received a record 61,285 removal applications, the highest in the whole state.
The same picture appears in nearby districts. Murshidabad has the most removal applications in the state, at 326,266. That is 43.6 percent of its total appeals. The rate is 47.8 percent in North Dinajpur and 49.8 percent in Birbhum. Just the 34 seats of Malda and Murshidabad together have about 636,873 removal appeals. That is nearly two fifths, or 40 percent, of all removal appeals in West Bengal.
A statewide web of administrative appeals
The ECI’s own data shows the huge size of this campaign. Last month, the commission told the Supreme Court that voters filed 3,831,429 appeals before the tribunals in total. Of these, removed voters filed 2,221,118 to get their names back. The other 1,610,311 appeals ask to cut the names of valid voters.
This means that judges and judicial officers cleared 3,277,360 voters across the state. Now 49.1 percent of them face removal applications again. The state figure almost exactly matches the Chanchal rate.
The commission gave these figures to the Supreme Court. However, it strangely avoided saying which areas have more of them or who filed them. Still, documents reveal the truth. Two orders of Appellate Tribunal Number 11 in Murshidabad, issued earlier this year, state at the very start who filed these appeals. They say the state’s Additional Chief Electoral Officer filed the appeals against the inclusion of voters.
How researchers counted the removal appeals
The researchers cross checked the affidavits that the ECI submitted against their own data. They took the total appeals and subtracted the appeals that ordinary voters filed. This gave them the number of removal appeals that officials filed.
However, the investigation hit a technical barrier. The commission published its voter list and removal list as PDF files. This made it very hard to check the data of about 230,000 voters. Also, the commission started an OTP system for every search last month. This made matching data even harder. The researchers then adjusted the numbers in proportion to the removed voters. Their count shows that 42 percent of all appeals in the state are removal appeals. This fully matches the ECI figure that the commission gave the Supreme Court.
The researchers’ count and the figure from Mr. Indrajit Chatterjee, a retired judge of Appellate Tribunal Number 11 in Murshidabad, tell the same story. His tribunal covers 11 Murshidabad seats with more than 635,000 appeals. The state’s Additional CEO filed about 254,000 of them, or 40 percent. The researchers’ independent method counted 261,000 removal appeals in those 11 seats, or 41.1 percent. The gap between the judge’s figure and the journalists’ finding is only 7,461 appeals, or 1.1 percent. This clearly proves that no ordinary citizen made this effort on a personal basis. It is an organised administrative step of the Election Commission.
Targets chosen by population
The data shows that these administrative removal appeals are not random. The share of Muslims in an area has a very deep and direct link with the number of removal appeals. In assembly seats with more than 60 percent Muslims, there are 7.85 removal appeals for every 100 voters. In seats with less than 20 percent Muslims, the rate is only 0.80 for every 100 voters. That is a difference of about 10 times. Chanchal has 51.96 percent Muslims and 13.39 removal applications for every 100 voters. This is the fourth highest in the state.
One point stands out, though. This process did not target Scheduled Caste voters. The state has 23.34 percent Scheduled Caste people, yet the data found no link between their population and the appeals.
We also cannot dismiss this as simple “revenge against anti BJP voters.” The data shows that appeals continued even in Muslim majority areas where people voted for the BJP. There are 8 seats with more than 40 percent Muslims where the BJP still won more than 40 percent of the votes. Even in those seats, there are 5.33 removal applications for every 100 voters. That is more than double the state average.
For example, Manikchak in Malda has 42.37 percent Muslims, and the BJP won 48.9 percent of the votes there. It has 9.6 appeals for every 100 voters. Vaishnabnagar has 44.44 percent Muslims, and the BJP won 48.3 percent of the votes. It has 9.2 appeals for every 100 voters.
Political effects and fears for the future
Officials filed these administrative applications early in the year. They targeted citizens whose names the authorities had already checked and kept on the voter list. The Supreme Court ruled that voters with appeals pending at a tribunal cannot vote. That ruling mainly applied to removed voters seeking to restore their names. It did not apply to voters who stayed on the list.
So voters facing removal applications could vote in the last election. The real danger lies in future elections and the new voter list. Removal appeals across the state equal 2.37 percent of all voters in 2026. The picture by party of the winning seats shows the same population pattern. Congress won 2 seats, both in Murshidabad. They have 12 removal applications for every 100 voters. That is 10 times higher than the seats the BJP won. Raninagar has 75.40 percent Muslims and 14.8 appeals for every 100 voters. That is the second highest in the state.
The BJP won 202 seats, and those seats have 1.21 removal appeals for every 100 voters. But in the 87 seats that the BJP lost, there are 962,197 removal applications. That is 4.18 for every 100 voters. In the 7 seats that the ISF, the CPI(M) and other opposition parties won, the average Muslim share is 62.1 percent. The rate there is 5.45 appeals for every 100 voters. That is even higher than in the seats of the ruling Trinamool.
The math that can change election results
If these state run appeals succeed, the effects will reach far. In 26 seats of the state, the number of pending removal applications is bigger than the winning margin of the 2006 election in those seats.
These 26 seats have 35.6 percent Muslims on average. The Trinamool won 12 of them, the BJP won 11 and other parties won 3. In Amdanga, the pending removal applications are 3.7 times the winning margin. In Hariharpara, they are 3.4 times, and in Suti, they are 2.8 times.
If the commission’s or the state’s appeals win approval, authorities will cut more people from the list than the winning margin. This could change the political map itself.
The ECI now says that people removed in the special revision can return through Form 6. But that path stays closed for more than 2 million voters whose cases are pending at the tribunals. So millions of ordinary people now live in deep uncertainty. They face a long legal fight to prove their validity and the danger of losing their right to vote.